ENG
ENG- Branchen
- Finanzen
Nearshore-Softwareentwicklung für den Finanzsektor – sicher, skalierbar und Compliance-gerechte Lösungen für Banking, Zahlungsverkehr und APIs.
- Einzelhandel
Softwareentwicklung für den Einzelhandel – E-Commerce, Kassensysteme, Logistik und KI-gestützte Personalisierung durch unsere Nearshore-Engineering-Teams.
- Verarbeitende Industrie
Nearshore-Softwareentwicklung für die Industrie – ERP-Systeme, IoT-Plattformen und Automatisierungstools zur Optimierung industrieller Abläufe.
- Finanzen
- Was wir tun
- Services
- Technologien
- Kooperationsmodelle
Kooperationsmodelle passend zu Ihren Bedürfnissen: Komplette Nearshoring Teams, deutschsprachige Experten vor Ort mit Nearshoring-Teams oder gemischte Teams mit unseren Partnern.
- Arbeitsweise
Durch enge Zusammenarbeit mit Ihrem Unternehmen schaffen wir maßgeschneiderte Lösungen, die auf Ihre Anforderungen abgestimmt sind und zu nachhaltigen Ergebnissen führen.
- Über uns
- Wer wir sind
Wir sind ein Full-Service Nearshoring-Anbieter für digitale Softwareprodukte, ein perfekter Partner mit deutschsprachigen Experten vor Ort, Ihre Business-Anforderungen stets im Blick
- Unser Team
Das ProductDock Team ist mit modernen Technologien und Tools vertraut und setzt seit 15 Jahren zusammen mit namhaften Firmen erfolgreiche Projekte um.
- Wozu Nearshoring
Wir kombinieren Nearshore- und Fachwissen vor Ort, um Sie während Ihrer gesamten digitalen Produktreise optimal zu unterstützen. Lassen Sie uns Ihr Business gemeinsam auf das nächste digitale Level anheben.
- Wer wir sind
- Unser Leistungen
- Karriere
- Arbeiten bei ProductDock
Unser Fokus liegt auf der Förderung von Teamarbeit, Kreativität und Empowerment innerhalb unseres Teams von über 120 talentierten Tech-Experten.
- Offene Stellen
Begeistert es dich, an spannenden Projekten mitzuwirken und zu sehen, wie dein Einsatz zu erfolgreichen Ergebnissen führt? Dann bist du bei uns richtig.
- Info Guide für Kandidaten
Wie suchen wir unsere Crew-Mitglieder aus? Wir sehen dich als Teil unserer Crew und erklären gerne unseren Auswahlprozess.
- Arbeiten bei ProductDock
- Newsroom
- News
Folgen Sie unseren neuesten Updates und Veröffentlichungen, damit Sie stets über die aktuellsten Entwicklungen von ProductDock informiert sind.
- Events
Vertiefen Sie Ihr Wissen, indem Sie sich mit Gleichgesinnten vernetzen und an unseren nächsten Veranstaltungen Erfahrungen mit Experten austauschen.
- News
- Blog
- Kontakt

12. Juni 2025 •5 minutes read
Observability for Spring applications
Bojan Ćorić
Sofware Engineer
In today’s world of microservices, distributed systems, and cloud-native applications, complexity is the new normal. At its core, observability is the ability to understand what’s happening inside a system just by examining its external outputs—logs, metrics, and traces. It answers not just “Is the system up?”, but also “Why is it behaving this way?”
The importance of observability
1. Faster incident resolution
When a system fails or behaves unexpectedly, time is of the essence. With good observability, engineers can quickly trace problems back to their root causes — whether it’s a misconfigured service, a failed dependency, or a performance bottleneck.
Instead of scrambling through logs on multiple machines, observability tools centralize and correlate data to give you context in minutes.
2. Proactive problem detection
Monitoring often catches symptoms, not causes. Observability surfaces anomalies and unusual patterns before they turn into full-blown outages. That means fewer support calls, happier users, and more sleep for on-call engineers.
3. Improved developer productivity
Debugging in a highly distributed system can be like searching for a needle in a haystack. But if your services emit rich logs, useful metrics, and distributed traces, developers can debug issues independently and with confidence.
It also empowers teams to release faster, experiment more, and recover from failure quickly—a hallmark of mature engineering practices.
4. Better user experience
Downtime and performance lags aren’t just technical problems—they’re business problems. Observability enables teams to understand how their systems affect the end-user experience, identify slow paths, and fix latency issues that would otherwise erode user trust.
5. Supports modern architectures
Whether you’re using containers, Kubernetes, serverless, or event-driven architectures, observability isn’t optional—it’s critical. These environments are dynamic and ephemeral. Without observability, diagnosing issues in production can feel like trying to solve a puzzle with half the pieces missing.
Key pillars of observability
To be effective, observability typically relies on three data types:
- Logs – Textual records of discrete events.
- Metrics – Numeric data measuring performance or state over time.
- Traces – End-to-end details of requests across services.
Why Micrometer is the right tool for Spring applications
If you’re building Spring Boot applications and looking to improve observability, Micrometer is a perfect match. It’s the metrics collection library baked right into the Spring ecosystem, designed to provide vendor-neutral observability with minimal configuration.
1. First-class Spring Boot integration
Micrometer is the default metrics facade in Spring Boot Actuator. That means if you’re using Spring Boot, you’re already halfway there. With a simple dependency and a few lines of configuration, your application can start emitting a rich set of metrics instantly—CPU usage, HTTP response times, JVM memory, garbage collection, and more.
2. Vendor-neutral API with pluggable backends
Micrometer gives you the freedom to choose your metrics backend without vendor lock-in. It supports:
- Prometheus
- Datadog
- New Relic
- Elastic
- Azure Monitor
- CloudWatch, and more.
You instrument your code once and decide later how and where to export metrics. This makes it easy to switch observability providers or support multiple environments.
3. Out-of-the-box metrics for everything
Once enabled, Micrometer auto-instruments dozens of Spring Boot components:
- HTTP client/server metrics
- JDBC metrics
- Thread pools
- Cache statistics (Caffeine, Redis, etc.)
- Kafka and RabbitMQ integration
- WebClient & RestTemplate timing
This means rich observability with minimal effort, giving you insights into performance, throughput, and failures from day one.
4. Supports dimensional metrics
Unlike traditional flat metrics, Micrometer embraces dimensional metrics—where a single metric (like http.server.requests) can have many tags (method, status, endpoint, etc.). This allows powerful, filterable queries and visualizations in tools like Prometheus and Grafana.
5. Production-grade and battle-tested
Micrometer is used by large-scale systems across industries and backed by the Spring team. It’s battle-tested, highly performant, and designed for production workloads. Its low overhead and configurable sampling make it suitable even for high-throughput applications.
Wire up everything with Grafana
Grafana is not just a dashboarding tool — it has evolved into a complete observability platform. What makes Grafana particularly powerful is its ability to unify:
- Metrics: Grafana connects seamlessly with popular time-series databases such as Prometheus, InfluxDB, and Graphite. This makes it easy to visualize system and application performance indicators like CPU usage, request latency, and error rates.
- Logs: With integrations like Loki, Grafana lets you explore logs side by side with metrics. This correlation is key: you can jump from a spike in errors in your dashboard directly into the logs that explain why the issue occurred.
- Traces: Grafana supports distributed tracing tools like Tempo, Jaeger, and Zipkin. This allows you to track the journey of a request through microservices, identify bottlenecks, and understand how different services interact.
Let’s make this concrete with a demo example.
Imagine we’re running a Beer Rating System made up of two microservices:
- beer-rating: handles user interactions and lets users submit ratings for beers.
- beer-catalog: verifies beer information and manages the catalog of available beers.
Here’s the flow:
When a user submits a rating through the beer-rating service, it calls the beer-catalog service to validate the beer information before saving the rating.
However, users begin reporting that for certain beers, they encounter an Internal Server Error when trying to submit their ratings.
By checking our Grafana dashboards, we notice a pattern — about 10% of requests are failing.
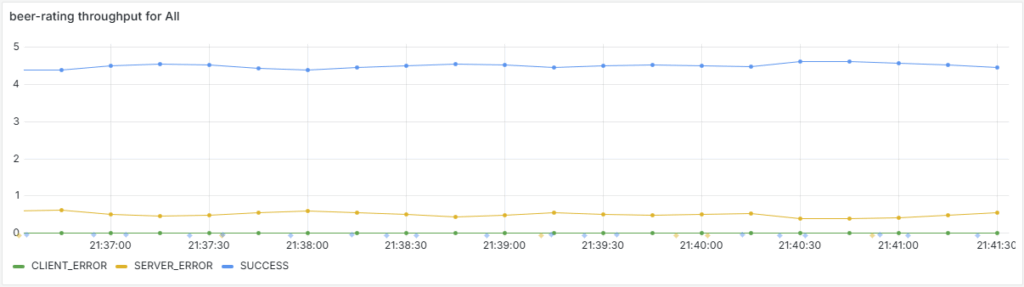
Looking closer at the metrics, we spot small rectangles along the graph. These are exemplars — individual request traces sampled from the traffic. When we hover over one, Grafana shows trace details for that specific failing request.
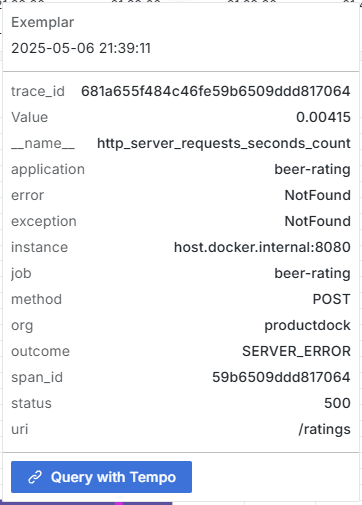
Clicking through takes us to the Tempo trace view, where we can examine the request’s journey through the system.
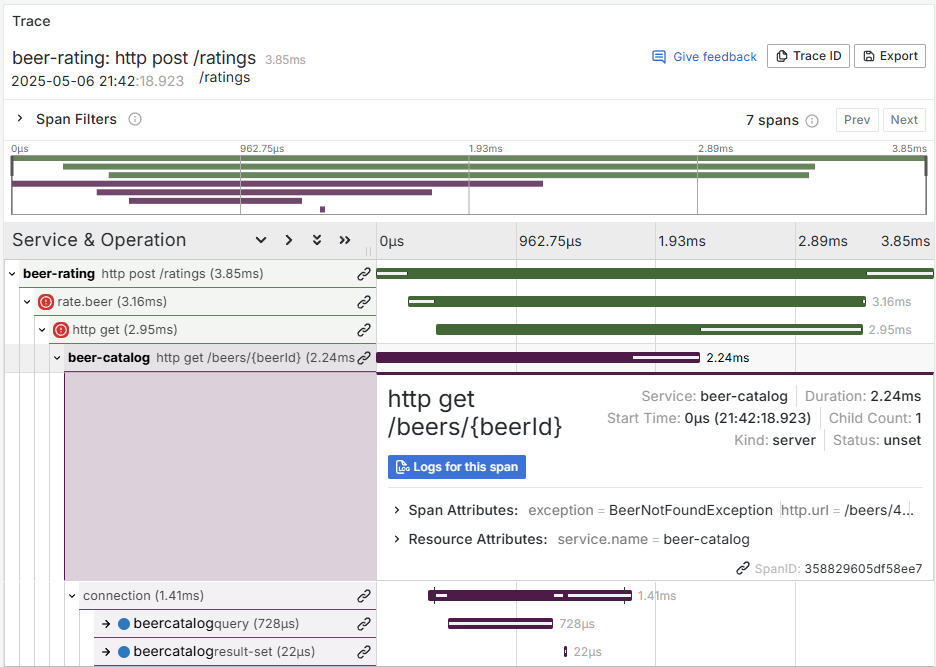
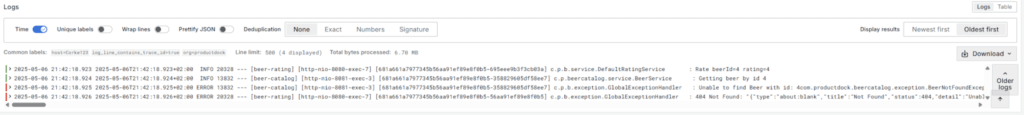
From there, the span view reveals logs from all involved services, neatly ordered by time, making it easy to trace exactly where things went wrong.
Check out this github repo for a full example.
Conclusion
As systems grow in complexity and scale, observability emerges as one of the most critical pillars of reliable software delivery. It empowers teams to not only detect and resolve incidents faster but also to proactively improve system reliability, enhance developer productivity, and deliver a superior user experience.
For Spring applications, tools like Micrometer make it incredibly straightforward to gather rich, production-grade metrics with minimal effort, while maintaining the flexibility to integrate with a wide variety of observability backends. When combined with a powerful platform like Grafana, which unifies metrics, logs, and traces, observability becomes actionable. Issues that once took hours or days to diagnose can now be pinpointed and resolved in minutes.
Tags:Skip tags

Bojan Ćorić
Sofware EngineerBojan is a backend software developer at ProductDock, specializing in Java and Spring. He has been actively involved in developing robust and scalable backend systems for the past two years. His expertise in these technologies and his dedication to continuous learning make him a valuable asset in the field of software development.
Related posts.

Allgemein, Backend
The C4 model for visualizing software architecture
Ladislav Milunović• 02. Apr. 2026
Find out more
Backend
A practical overview of SOLID design principles in Java
Nemanja Marić• 25. März 2026
Find out more